SDG Bangkok Profile 2024
สรุปความคืบหน้าการพัฒนาที่ยั่งยืนของกรุงเทพมหานคร 17 เป้าหมาย เทียบค่าเฉลี่ยระดับประเทศ พร้อมความเห็นของประชาชน — รายละเอียดตัวชี้วัด บทวิเคราะห์ และการเชื่อมโยงยุทธศาสตร์ ดูที่A summary of Bangkok’s progress on the 17 Sustainable Development Goals compared with the national average, with citizens’ views. For indicator details, analysis and links to strategy, see the รายงานฉบับเต็มfull report
กรุงเทพฯ ทำได้ดีกว่าค่าเฉลี่ยประเทศBangkok beats the national average on 8 จาก 17 เป้าหมาย8 of 17 goals
ระดับผลการดำเนินงานของแต่ละเป้าหมายเทียบกับค่าเฉลี่ยระดับประเทศจากข้อมูลเปิดภาครัฐ (58 ตัวชี้วัดที่ติดตามได้) — คลิกเป้าหมายเพื่อดูตัวชี้วัด จุดแข็ง และความท้าทายHow each goal performs against the national average, using open government data (58 trackable indicators). Click a goal to see its indicators, strengths and challenges.
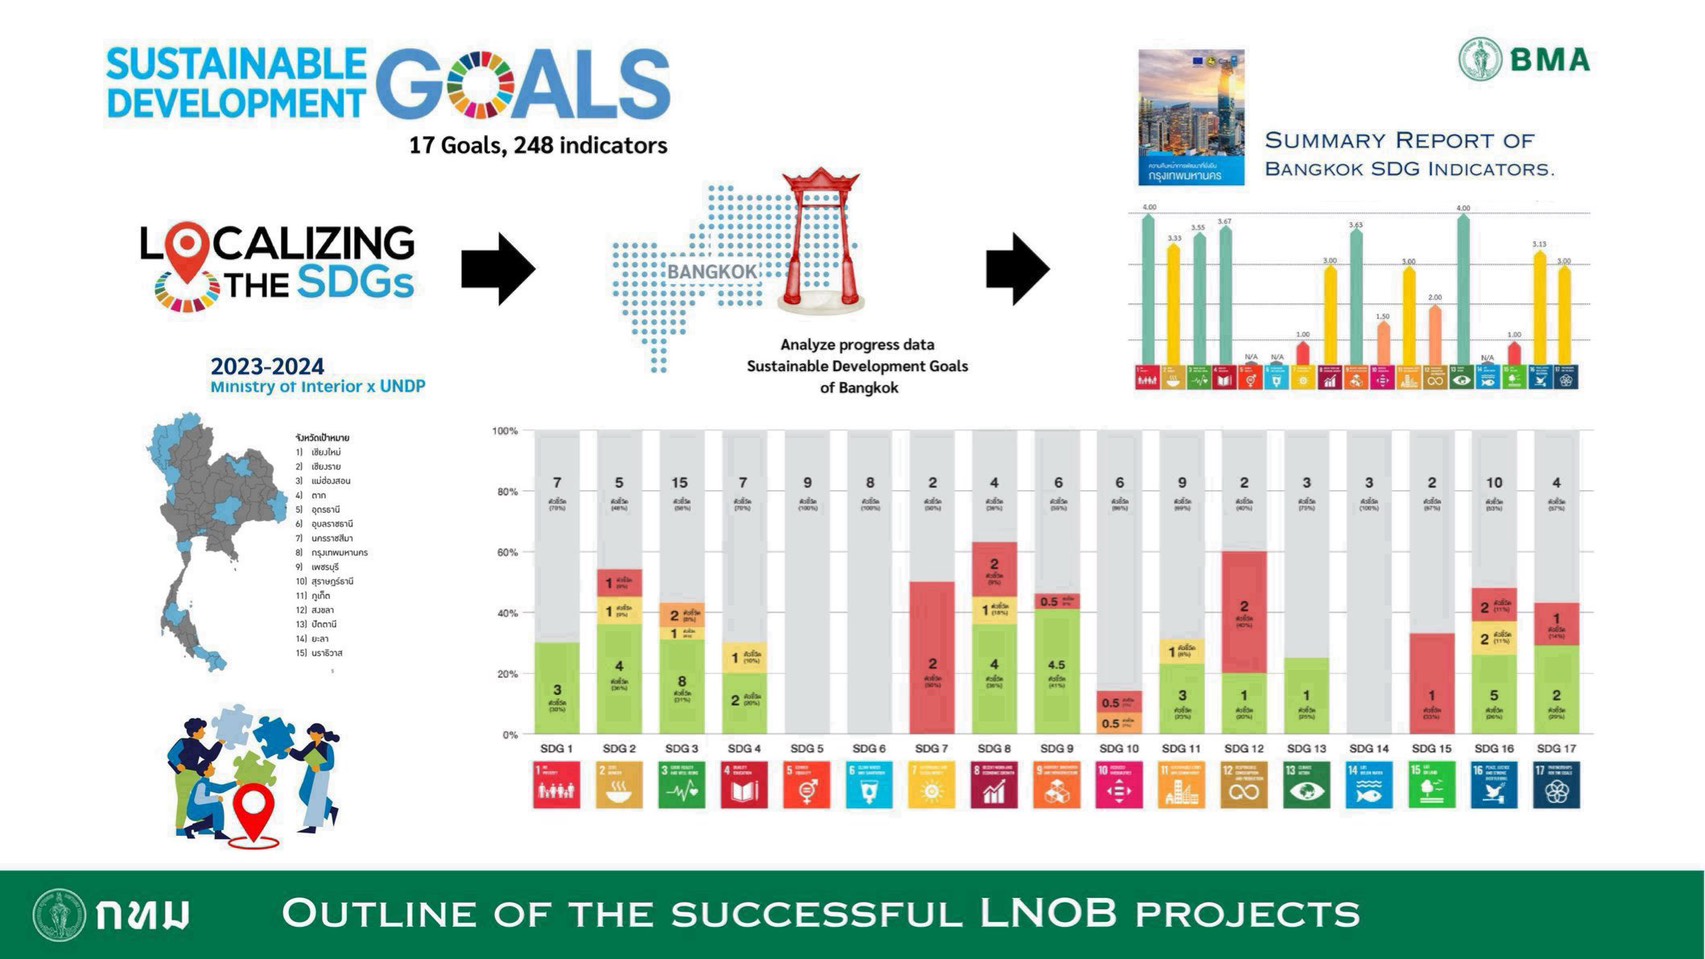
การพัฒนาที่ยั่งยืนของกรุงเทพมหานครSustainable development in Bangkok Localizing the SDGs · 17 Goals, 248 indicators
ยุติความยากจนทุกรูปแบบในทุกที่End poverty in all its forms everywhere
ดีกว่าค่าเฉลี่ยประเทศBetter than the national average 3 ตัวชี้วัดที่ติดตามได้trackable indicatorsกรุงเทพฯ มีผลดำเนินงานสูงกว่าค่าประเทศทั้ง 3 ตัวชี้วัด สะท้อนว่าปัญหาความยากจนในกรุงเทพฯ น้อยกว่าค่าเฉลี่ยประเทศ อย่างไรก็ตาม ยังมีประชากรแฝงที่เข้าไม่ถึงสาธารณูปโภคขั้นพื้นฐานBangkok outperforms the national average on all 3 indicators, showing that poverty in Bangkok is lower than in the country as a whole. However, the unregistered population still lacks access to basic utilities.
ตัวชี้วัดของกรุงเทพฯBangkok’s indicators (3)
| รหัสCode | ตัวชี้วัดIndicator | ค่ากรุงเทพฯBangkok value | ระดับเทียบค่าประเทศLevel vs national |
|---|---|---|---|
| 1.2.1 | สัดส่วนคนจน ด้านรายจ่ายอุโภคบริโภค (%)Proportion of the population living below the poverty line, by consumption (%) | 0.38 | ดีกว่าค่าเฉลี่ยประเทศBetter than the national average |
| 1.3.1 | สัดส่วนแรงงานที่มีสวัสดิการ (%)Proportion of workers covered by social protection (%) | 92.81 | ดีกว่าค่าเฉลี่ยประเทศBetter than the national average |
| 1.5.1 | ประชากรที่ประสบภัยพิบัติ (คน/แสน)People affected by disasters (per 100,000) | 1.03 | ดีกว่าค่าเฉลี่ยประเทศBetter than the national average |
จุดแข็งStrengths
- สัดส่วนคนจนต่ำมาก (0.38%)Very low share of people in poverty (0.38%)
- สวัสดิการแรงงานสูงกว่าค่าประเทศSocial protection for workers is above the national average
- ระบบรับมือภัยพิบัติมีประสิทธิภาพEffective disaster-response system
ความท้าทายChallenges
- ประชากรแฝงในชุมชนแออัดยังเข้าไม่ถึงบริการUnregistered residents of crowded communities still lack access to services
- ข้อมูลตัวชี้วัด 1.1.1, 1.4.1-2 ยังขาดData for indicators 1.1.1 and 1.4.1–2 is missing
ยุติความหิวโหย บรรลุความมั่นคงทางอาหารEnd hunger and achieve food security
ดีกว่าค่าเฉลี่ยประเทศBetter than the national average 4 ตัวชี้วัดที่ติดตามได้trackable indicatorsกรุงเทพฯ มีผลการดำเนินงานสูงกว่าค่าประเทศในเรื่องโภชนาการ การเข้าถึงอาหาร แต่ยังขาดข้อมูลด้านการเกษตรยั่งยืนBangkok outperforms the national average on nutrition and access to food, but data on sustainable agriculture is still missing.
ตัวชี้วัดของกรุงเทพฯBangkok’s indicators (4)
| รหัสCode | ตัวชี้วัดIndicator | ค่ากรุงเทพฯBangkok value | ระดับเทียบค่าประเทศLevel vs national |
|---|---|---|---|
| 2.1.1 | ความชุกของภาวะขาดอาหาร (%)Prevalence of undernourishment (%) | 0.70 | ดีกว่าค่าเฉลี่ยประเทศBetter than the national average |
| 2.2.1 | อัตราเตี้ยแคระในเด็ก (%) อายุ 0-5 ปีPrevalence of stunting among children aged 0–5 (%) | 7.30 | ดีกว่าค่าเฉลี่ยประเทศBetter than the national average |
| 2.2.2(a) | ภาวะผอมโซในเด็กอายุ 0-5 ปี (%)Prevalence of wasting among children aged 0–5 (%) | 4.80 | ดีกว่าค่าเฉลี่ยประเทศBetter than the national average |
| 2.2.2(b) | ภาวะน้ำหนักเกินในเด็กอายุ 0-5 ปี (%)Prevalence of overweight among children aged 0–5 (%) | 5.70 | ต่ำกว่าประเทศไม่เกิน 10%Up to 10% below national |
จุดแข็งStrengths
- อัตราขาดอาหารต่ำมาก (0.70%)Very low rate of undernourishment (0.70%)
- ภาวะเตี้ยแคระในเด็กน้อยกว่าค่าประเทศChild stunting is below the national average
ความท้าทายChallenges
- ภาวะน้ำหนักเกินในเด็กมีแนวโน้มสูงขึ้นOverweight among children is rising
- ขาดข้อมูลเกษตรยั่งยืน ตัวชี้วัด 2.3.x, 2.4.x, 2.5.xNo data on sustainable agriculture (indicators 2.3.x, 2.4.x, 2.5.x)
สร้างหลักประกันให้คนมีชีวิตที่มีสุขภาพดีEnsure healthy lives and promote well-being for all
ดีกว่าค่าเฉลี่ยประเทศBetter than the national average 6 ตัวชี้วัดที่ติดตามได้trackable indicatorsกรุงเทพฯ มีผลดำเนินงานสูงกว่าค่าประเทศในส่วนใหญ่ของตัวชี้วัดสุขภาพ ทั้งอัตราตายมารดา เด็ก โรคติดต่อ และการเข้าถึงบริการสุขภาพBangkok outperforms the national average on most health indicators, including maternal and child mortality, communicable diseases and access to health services.
ตัวชี้วัดของกรุงเทพฯBangkok’s indicators (6)
| รหัสCode | ตัวชี้วัดIndicator | ค่ากรุงเทพฯBangkok value | ระดับเทียบค่าประเทศLevel vs national |
|---|---|---|---|
| 3.1.1 | อัตราตายมารดาต่อการเกิดมีชีพ 1 แสนคนMaternal mortality ratio (per 100,000 live births) | 18.90 | ดีกว่าค่าเฉลี่ยประเทศBetter than the national average |
| 3.2.1 | อัตราตายของเด็กอายุต่ำกว่า 5 ปี (ต่อ 1,000 คนเกิดมีชีพ)Under-5 mortality rate (per 1,000 live births) | 7.60 | ดีกว่าค่าเฉลี่ยประเทศBetter than the national average |
| 3.3.1 | จำนวนผู้ติดเชื้อใหม่ HIV (ต่อ 1,000 คน)New HIV infections (per 1,000 population) | 0.06 | ดีกว่าค่าเฉลี่ยประเทศBetter than the national average |
| 3.3.4 | อุบัติการณ์ไวรัสตับอักเสบบี (ต่อ 100,000 คน)Hepatitis B incidence (per 100,000 population) | 0.71 | ดีกว่าค่าเฉลี่ยประเทศBetter than the national average |
| 3.4.1 | อัตราตายจากโรคหัวใจและหลอดเลือด มะเร็ง เบาหวาน โรคทางเดินหายใจ (ต่อ 100,000 คน)Mortality from cardiovascular disease, cancer, diabetes or chronic respiratory disease (per 100,000) | 233.14 | ต่ำกว่าประเทศไม่เกิน 10%Up to 10% below national |
| 3.6.1 | อัตราตายจากการบาดเจ็บทางจราจร (ต่อ 100,000 คน)Death rate due to road traffic injuries (per 100,000) | 7.00 | ดีกว่าค่าเฉลี่ยประเทศBetter than the national average |
จุดแข็งStrengths
- อัตราตายมารดาต่ำกว่าค่าประเทศมากMaternal mortality is far below the national average
- ระบบสาธารณสุขแข็งแกร่งStrong public health system
- การเข้าถึงบริการสุขภาพสูงHigh access to health services
ความท้าทายChallenges
- โรค NCDs เป็นความท้าทายสำคัญNon-communicable diseases (NCDs) are a major challenge
- อุบัติเหตุทางถนนยังเป็นปัญหาRoad accidents remain a problem
- ขาดข้อมูลสุขภาพจิต (3.4.2)No data on mental health (3.4.2)
สร้างหลักประกันให้ทุกคนได้รับการศึกษาที่มีคุณภาพEnsure inclusive and equitable quality education for all
ดีกว่าค่าเฉลี่ยประเทศBetter than the national average 4 ตัวชี้วัดที่ติดตามได้trackable indicatorsกรุงเทพฯ มีผลดำเนินงานสูงกว่าค่าประเทศในด้านการเข้าถึงการศึกษาขั้นพื้นฐาน แต่ยังมีช่องว่างด้านทักษะดิจิทัลและการศึกษาผู้ใหญ่Bangkok outperforms the national average on access to basic education, but gaps remain in digital skills and adult education.
ตัวชี้วัดของกรุงเทพฯBangkok’s indicators (4)
| รหัสCode | ตัวชี้วัดIndicator | ค่ากรุงเทพฯBangkok value | ระดับเทียบค่าประเทศLevel vs national |
|---|---|---|---|
| 4.1.1(a) | สัดส่วนนักเรียนที่มีระดับความสามารถขั้นต่ำ ป.2-3 ภาษาไทย (%)Proportion of students in grades 2–3 achieving minimum proficiency in Thai (%) | 69.27 | ดีกว่าค่าเฉลี่ยประเทศBetter than the national average |
| 4.1.1(b) | สัดส่วนนักเรียนที่มีระดับความสามารถขั้นต่ำ ป.6 ภาษาไทย (%)Proportion of students in grade 6 achieving minimum proficiency in Thai (%) | 55.88 | ดีกว่าค่าเฉลี่ยประเทศBetter than the national average |
| 4.2.1 | สัดส่วนเด็กอายุ 36-59 เดือนที่มีพัฒนาการตามวัย (%)Proportion of children aged 36–59 months who are developmentally on track (%) | 88.79 | ดีกว่าค่าเฉลี่ยประเทศBetter than the national average |
| 4.3.1 | สัดส่วนเยาวชนและผู้ใหญ่ที่เข้าร่วมการฝึกอบรมอย่างเป็นทางการ (%)Participation of youth and adults in formal training (%) | 16.96 | ดีกว่าค่าเฉลี่ยประเทศBetter than the national average |
จุดแข็งStrengths
- การเข้าถึงการศึกษาขั้นพื้นฐานสูงHigh access to basic education
- พัฒนาการเด็กปฐมวัยดีกว่าค่าประเทศEarly childhood development is better than the national average
ความท้าทายChallenges
- คุณภาพการเรียนรู้ยังไม่สม่ำเสมอLearning quality is still uneven
- ขาดข้อมูลทักษะดิจิทัล 4.4.1No data on digital skills (4.4.1)
- ช่องว่างระหว่างกลุ่มรายได้Gaps between income groups
บรรลุความเท่าเทียมทางเพศAchieve gender equality
ติดตามประเมินไม่ได้Cannot be assessed 1 ตัวชี้วัดที่ติดตามได้trackable indicatorsกรุงเทพฯ ยังไม่สามารถติดตามและประเมินผลตัวชี้วัดส่วนใหญ่ในเป้าหมายนี้ได้ เนื่องจากขาดการเก็บข้อมูลระดับจังหวัดแบบแยกเพศBangkok cannot yet track or assess most indicators under this goal, because sex-disaggregated data is not collected at the provincial level.
ตัวชี้วัดของกรุงเทพฯBangkok’s indicators (1)
| รหัสCode | ตัวชี้วัดIndicator | ค่ากรุงเทพฯBangkok value | ระดับเทียบค่าประเทศLevel vs national |
|---|---|---|---|
| 5.2.1 | สัดส่วนผู้หญิงที่เคยมีคู่ครองที่เผชิญความรุนแรงทางร่างกายและ/หรือทางเพศ (%)Proportion of ever-partnered women subjected to physical and/or sexual violence (%) | 17.20 | เทียบไม่ได้Not comparable |
จุดแข็งStrengths
- มีการเก็บข้อมูลคำร้องเรียนบางส่วนSome complaint data is collected
- มีหน่วยงานรับเรื่องร้องทุกข์ OSCCOSCC one-stop crisis centres receive complaints
ความท้าทายChallenges
- ไม่สามารถเปรียบเทียบกับค่าประเทศได้Cannot be compared with national figures
- ขาดการเปิดเผยข้อมูลระหว่างหน่วยงานData is not shared between agencies
- ตัวชี้วัด 5.1.1, 5.3.1-2, 5.4.1, 5.5.1 ยังขาดข้อมูลIndicators 5.1.1, 5.3.1–2, 5.4.1 and 5.5.1 lack data
สร้างหลักประกันให้มีน้ำสะอาดใช้และสุขอนามัยสำหรับทุกคนEnsure clean water and sanitation for all
ติดตามประเมินไม่ได้Cannot be assessed 0 ตัวชี้วัดที่ติดตามได้trackable indicatorsกรุงเทพฯ ยังไม่สามารถติดตามและประเมินผลตัวชี้วัดในเป้าหมายนี้ได้ เนื่องจากขาดการเก็บข้อมูลอย่างต่อเนื่องBangkok cannot yet track or assess the indicators under this goal, because the data is not collected consistently.
ตัวชี้วัดของกรุงเทพฯBangkok’s indicators (0)
จุดแข็งStrengths
- กรุงเทพฯ มีเป้าหมายพัฒนาคุณภาพแหล่งน้ำBangkok has targets to improve water quality
- สำนักระบายน้ำสามารถสนับสนุนข้อมูลในอนาคตThe Drainage and Sewerage Department can supply data in future
ความท้าทายChallenges
- ตัวชี้วัด 6.1.1, 6.2.1, 6.3.1, 6.3.2, 6.4.1, 6.4.2, 6.6.1 ยังไม่สามารถติดตามได้Indicators 6.1.1, 6.2.1, 6.3.1, 6.3.2, 6.4.1, 6.4.2 and 6.6.1 cannot yet be tracked
- ต้องประสานงานขอข้อมูลจากหน่วยงานเจ้าของข้อมูลData must be requested from the agencies that own it
สร้างหลักประกันให้ทุกคนเข้าถึงพลังงานสมัยใหม่ในราคาที่เหมาะสมและยั่งยืนEnsure access to affordable, reliable, sustainable and modern energy for all
ต่ำกว่าประเทศเกิน 20%More than 20% below national 3 ตัวชี้วัดที่ติดตามได้trackable indicatorsกรุงเทพฯ มีผลการดำเนินงานต่ำกว่าค่าประเทศสำหรับพลังงานหมุนเวียน แต่มีทิศทางที่ดีจากการส่งเสริมการติดตั้งโซลาร์เซลล์Bangkok performs below the national average on renewable energy, but the trend is positive thanks to the promotion of solar panels.
ตัวชี้วัดของกรุงเทพฯBangkok’s indicators (3)
| รหัสCode | ตัวชี้วัดIndicator | ค่ากรุงเทพฯBangkok value | ระดับเทียบค่าประเทศLevel vs national |
|---|---|---|---|
| 7.2.1(b) | สัดส่วนการใช้พลังงานทดแทนต่อการใช้ไฟฟ้าสุดท้าย (กิโลวัตต์/1,000 กิกะวัตต์)Renewable energy share of final electricity consumption (kW per 1,000 GW) | 0.37 | ต่ำกว่าประเทศเกิน 20%More than 20% below national |
| 7.b.1(a) | การผลิตพลังงานหมุนเวียนที่ติดตั้ง (MW)Installed renewable energy generating capacity (MW) | 10.55 | เทียบไม่ได้Not comparable |
| 7.b.1(b) | การผลิตพลังงานหมุนเวียนที่ติดตั้ง (วัตต์/หัว)Installed renewable energy generating capacity (watts per capita) | 1.87 | ต่ำกว่าประเทศเกิน 20%More than 20% below national |
จุดแข็งStrengths
- มีแนวโน้มการติดตั้งโซลาร์เซลล์เพิ่มขึ้นSolar panel installations are increasing
- มีแผนส่งเสริมพลังงานหมุนเวียนThere is a plan to promote renewable energy
ความท้าทายChallenges
- สัดส่วนพลังงานหมุนเวียน 0.37 ต่ำกว่าค่าประเทศมากRenewable energy share of 0.37 is far below the national average
- ต้องมีข้อมูลการเข้าถึงไฟฟ้าของกลุ่มประชากรในชุมชนแออัดData on electricity access in crowded communities is needed
ส่งเสริมการเติบโตทางเศรษฐกิจที่ต่อเนื่องครอบคลุมและยั่งยืนPromote sustained, inclusive and sustainable economic growth
ต่ำกว่าประเทศเกิน 20%More than 20% below national 7 ตัวชี้วัดที่ติดตามได้trackable indicatorsกรุงเทพฯ มีผลดำเนินงานสูงในด้านการเติบโตของรายได้ต่อหัว การจ้างงานนอกระบบ และรายได้จากผู้เยี่ยมเยือน แต่มีปัญหาด้านการเติบโตของรายได้ผู้มีงานทำBangkok performs well on per-capita income growth, informal employment and visitor revenue, but income growth for employed people is a problem.
ตัวชี้วัดของกรุงเทพฯBangkok’s indicators (7)
| รหัสCode | ตัวชี้วัดIndicator | ค่ากรุงเทพฯBangkok value | ระดับเทียบค่าประเทศLevel vs national |
|---|---|---|---|
| 8.1.1 | อัตราการเติบโตปีของรายได้ที่แท้จริงต่อหัวประชากร (%)Annual growth rate of real GDP per capita (%) | 2.18 | ดีกว่าค่าเฉลี่ยประเทศBetter than the national average |
| 8.2.1 | อัตราการเติบโตปีของรายได้ที่แท้จริงต่อประชากรผู้มีงานทำ (%)Annual growth rate of real GDP per employed person (%) | -0.73 | ต่ำกว่าประเทศเกิน 20%More than 20% below national |
| 8.3.1 | สัดส่วนการจ้างงานนอกระบบในการจ้างงานทั้งหมด (%)Proportion of informal employment in total employment (%) | 27.39 | ดีกว่าค่าเฉลี่ยประเทศBetter than the national average |
| 8.5.2 | อัตราการว่างงาน (%)Unemployment rate (%) | 1.26 | ต่ำกว่าประเทศไม่เกิน 10%Up to 10% below national |
| 8.6.1 | สัดส่วนเยาวชนที่ไม่ได้อยู่ในระบบการศึกษา จ้างงาน หรือฝึกอบรม (%)Proportion of youth not in education, employment or training (%) | 8.10 | ดีกว่าค่าเฉลี่ยประเทศBetter than the national average |
| 8.8.1 | การประสบอันตรายหรือเจ็บป่วยจากการทำงาน (คน/แสน)Occupational injuries and illnesses (per 100,000 workers) | 456.33 | ต่ำกว่าประเทศเกิน 20%More than 20% below national |
| 8.9.1(b) | อัตราการเติบโตของรายได้จากผู้เยี่ยมเยือน (%)Growth rate of revenue from visitors (%) | 35.88 | ดีกว่าค่าเฉลี่ยประเทศBetter than the national average |
จุดแข็งStrengths
- รายได้ต่อหัวเติบโต 2.18%Per-capita income grew 2.18%
- การจ้างงานนอกระบบต่ำ (27.39%)Low informal employment (27.39%)
- รายได้จากนักท่องเที่ยวเติบโตสูงStrong growth in tourism revenue
ความท้าทายChallenges
- รายได้ผู้มีงานทำติดลบ (-0.73%) ต่ำกว่าค่าประเทศ >20%Income per employed person fell (−0.73%), more than 20% below the national average
- การบาดเจ็บจากการทำงาน 456 คน/แสน ต่ำกว่าค่าประเทศ >20%Work-related injuries of 456 per 100,000, more than 20% worse than the national average
สร้างโครงสร้างพื้นฐานที่มีความทนทาน ส่งเสริมนวัตกรรมในทุกอุตสาหกรรมBuild resilient infrastructure and foster innovation in all industries
ดีกว่าค่าเฉลี่ยประเทศBetter than the national average 6 ตัวชี้วัดที่ติดตามได้trackable indicatorsกรุงเทพฯ มีผลดำเนินงานส่วนใหญ่สูงกว่าค่าประเทศ ทั้งโครงสร้างพื้นฐานถนน โทรคมนาคม การจ้างงาน และนวัตกรรมBangkok outperforms the national average on most indicators: road infrastructure, telecommunications, employment and innovation.
ตัวชี้วัดของกรุงเทพฯBangkok’s indicators (6)
| รหัสCode | ตัวชี้วัดIndicator | ค่ากรุงเทพฯBangkok value | ระดับเทียบค่าประเทศLevel vs national |
|---|---|---|---|
| 9.1.1 | หมู่บ้านที่ถนนสายหลักใช้ได้ตลอดปี (%)Villages with an all-season main road (%) | 95.13 | ดีกว่าค่าเฉลี่ยประเทศBetter than the national average |
| 9.2.1(a) | มูลค่าเพิ่มจากภาคอุตสาหกรรมต่อ GDP (%)Manufacturing value added as a share of GDP (%) | 11.69 | ต่ำกว่าประเทศเกิน 20%More than 20% below national |
| 9.2.1(b) | มูลค่าเพิ่มจากภาคอุตสาหกรรมต่อหัว (บาท/หัว)Manufacturing value added per capita (THB per person) | 66,526 | ดีกว่าค่าเฉลี่ยประเทศBetter than the national average |
| 9.2.2 | สัดส่วนการจ้างงานในอุตสาหกรรมการผลิต (%)Manufacturing employment as a share of total employment (%) | 17.83 | ดีกว่าค่าเฉลี่ยประเทศBetter than the national average |
| 9.5.2 | สัดส่วนนักวิจัยต่อประชากร 1 ล้านคนResearchers per million inhabitants | 7,056.99 | ดีกว่าค่าเฉลี่ยประเทศBetter than the national average |
| 9.c.1 | สัดส่วนประชากรที่มีโทรศัพท์มือถือ (%)Proportion of the population with a mobile phone (%) | 94.57 | ดีกว่าค่าเฉลี่ยประเทศBetter than the national average |
จุดแข็งStrengths
- โครงสร้างพื้นฐานถนนและโทรคมนาคมแข็งแกร่งStrong road and telecommunications infrastructure
- สัดส่วนนักวิจัยสูงมากVery high share of researchers
ความท้าทายChallenges
- มูลค่าเพิ่มภาคอุตสาหกรรมต่อ GDP ต่ำกว่าค่าประเทศมาก (11.69%)Manufacturing value added as a share of GDP is far below the national average (11.69%)
- ต้องส่งเสริมนวัตกรรมในอุตสาหกรรมให้มากขึ้นInnovation in industry needs more support
ลดความไม่เสมอภาคภายในและระหว่างประเทศReduce inequality within and among countries
ต่ำกว่าประเทศ 10–20%10–20% below national 2 ตัวชี้วัดที่ติดตามได้trackable indicatorsกรุงเทพฯ มีผลดำเนินงานต่ำกว่าค่าประเทศสำหรับประเด็นการถูกเลือกปฏิบัติหรือถูกคุกคามBangkok performs below the national average on discrimination and harassment.
ตัวชี้วัดของกรุงเทพฯBangkok’s indicators (2)
| รหัสCode | ตัวชี้วัดIndicator | ค่ากรุงเทพฯBangkok value | ระดับเทียบค่าประเทศLevel vs national |
|---|---|---|---|
| 10.3.1(a) | สัดส่วนผู้หญิงที่รู้สึกว่าถูกเลือกปฏิบัติหรือถูกคุกคาม (%)Proportion of women who felt discriminated against or harassed (%) | 12.95 | ต่ำกว่าประเทศเกิน 20%More than 20% below national |
| 10.3.1(b) | สัดส่วนผู้ชายที่รู้สึกว่าถูกเลือกปฏิบัติหรือถูกคุกคาม (%)Proportion of men who felt discriminated against or harassed (%) | 14.55 | ต่ำกว่าประเทศ 10–20%10–20% below national |
จุดแข็งStrengths
- ตัวชี้วัดความเหลื่อมล้ำด้านรายได้ระดับจังหวัดมีแนวโน้มพัฒนาขึ้นProvincial income-inequality indicators are improving
ความท้าทายChallenges
- การถูกเลือกปฏิบัติ/คุกคามในหญิงและชายยังสูงกว่าค่าประเทศDiscrimination and harassment of women and men is still above the national average
- ขาดการเปิดเผยข้อมูลความเหลื่อมล้ำด้านรายได้สาธารณะPublic data on income inequality is not published
ทำให้เมืองและการตั้งถิ่นฐานของมนุษย์มีความครอบคลุม ปลอดภัย มีภูมิต้านทานและยั่งยืนMake cities and human settlements inclusive, safe, resilient and sustainable
ดีกว่าค่าเฉลี่ยประเทศBetter than the national average 6 ตัวชี้วัดที่ติดตามได้trackable indicatorsกรุงเทพฯ มีผลดำเนินงานสูงกว่าค่าประเทศสำหรับส่วนใหญ่ แต่ยังมีปัญหาด้านมลพิษ PM2.5 และพื้นที่สีเขียวBangkok outperforms the national average on most indicators, but PM2.5 pollution and green space remain problems.
ตัวชี้วัดของกรุงเทพฯBangkok’s indicators (6)
| รหัสCode | ตัวชี้วัดIndicator | ค่ากรุงเทพฯBangkok value | ระดับเทียบค่าประเทศLevel vs national |
|---|---|---|---|
| 11.5.1 | ผู้เสียชีวิต สูญหาย และผู้ที่ได้รับผลกระทบโดยตรงจากภัยพิบัติ (คน/แสน)Deaths, missing persons and people directly affected by disasters (per 100,000) | 1.03 | ดีกว่าค่าเฉลี่ยประเทศBetter than the national average |
| 11.6.1 | สัดส่วนขยะมูลฝอยที่ถูกจัดเก็บและทิ้งอย่างเหมาะสม (%)Proportion of municipal solid waste collected and disposed of properly (%) | 77.85 | ดีกว่าค่าเฉลี่ยประเทศBetter than the national average |
| 11.6.2 | ค่าเฉลี่ยทั้งปีของฝุ่นละอองขนาดเล็ก PM2.5 (μg/m³)Annual mean level of fine particulate matter PM2.5 (μg/m³) | 26.72 | ต่ำกว่าประเทศไม่เกิน 10%Up to 10% below national |
| 11.7.1 | สัดส่วนพื้นที่สวนสาธารณะ (%)Proportion of public park area (%) | 2.55 | เทียบไม่ได้Not comparable |
| 11.7.2(a) | สัดส่วนผู้หญิงที่ประสบความรุนแรงทางร่างกายจากการถูกปล้น (%)Proportion of women who experienced physical violence from robbery (%) | 0.10 | ดีกว่าค่าเฉลี่ยประเทศBetter than the national average |
| 11.7.2(b) | สัดส่วนผู้ชายที่ประสบความรุนแรงทางร่างกายจากการถูกปล้น (%)Proportion of men who experienced physical violence from robbery (%) | 0.20 | ดีกว่าค่าเฉลี่ยประเทศBetter than the national average |
จุดแข็งStrengths
- ระบบจัดการภัยพิบัติดีGood disaster management system
- การจัดการขยะมูลฝอยสูงกว่าค่าประเทศSolid waste management is above the national average
- ความปลอดภัยในพื้นที่สาธารณะดีPublic spaces are safe
ความท้าทายChallenges
- PM2.5 เฉลี่ย 26.72 μg/m³ ยังสูงกว่ามาตรฐาน WHOAverage PM2.5 of 26.72 μg/m³ is still above the WHO guideline
- พื้นที่สีเขียวต่อหัวน้อยมาก (2.55%)Very little green space per person (2.55%)
สร้างหลักประกันให้มีรูปแบบการผลิตและการบริโภคที่ยั่งยืนEnsure sustainable consumption and production patterns
ต่ำกว่าประเทศเกิน 20%More than 20% below national 4 ตัวชี้วัดที่ติดตามได้trackable indicatorsกรุงเทพฯ มีผลดำเนินงานสูงกว่าค่าประเทศสำหรับของเสียอันตรายชุมชน แต่ยังมีช่องว่างด้านการนำขยะมูลฝอยกลับมาใช้ใหม่Bangkok outperforms the national average on household hazardous waste, but recycling of solid waste lags behind.
ตัวชี้วัดของกรุงเทพฯBangkok’s indicators (4)
| รหัสCode | ตัวชี้วัดIndicator | ค่ากรุงเทพฯBangkok value | ระดับเทียบค่าประเทศLevel vs national |
|---|---|---|---|
| 12.4.2(a) | ของเสียอันตรายชุมชนต่อหัว (กิโลกรัม)Household hazardous waste per capita (kg) | 1.32 | ดีกว่าค่าเฉลี่ยประเทศBetter than the national average |
| 12.4.2(b) | สัดส่วนของเสียอันตรายชุมชนที่ถูกส่งไปกำจัด (%)Proportion of household hazardous waste sent for treatment (%) | 100 | ดีกว่าค่าเฉลี่ยประเทศBetter than the national average |
| 12.5.1 | อัตราการนำขยะมูลฝอยกลับมาใช้ประโยชน์ (%)Solid waste recycling rate (%) | 19 | ต่ำกว่าประเทศเกิน 20%More than 20% below national |
| 12.a.1 | กำลังการผลิตพลังงานหมุนเวียนที่ติดตั้งแล้ว (วัตต์ต่อหัว)Installed renewable energy generating capacity (watts per capita) | 1.87 | ต่ำกว่าประเทศเกิน 20%More than 20% below national |
จุดแข็งStrengths
- ของเสียอันตรายชุมชน 100% ถูกส่งไปกำจัดอย่างถูกต้อง100% of household hazardous waste is sent for proper disposal
ความท้าทายChallenges
- อัตราการนำขยะกลับมาใช้ใหม่เพียง 19% ต่ำกว่าค่าประเทศมากกว่า 20%Recycling rate of only 19%, more than 20% below the national average
- ต้องพัฒนาระบบ Circular Economy อย่างจริงจังA circular economy needs to be developed in earnest
เร่งต่อสู้กับการเปลี่ยนแปลงสภาพภูมิอากาศและผลกระทบที่เกิดขึ้นTake urgent action to combat climate change and its impacts
ดีกว่าค่าเฉลี่ยประเทศBetter than the national average 1 ตัวชี้วัดที่ติดตามได้trackable indicatorsกรุงเทพฯ มีผลดำเนินงานสูงกว่าค่าประเทศสำหรับจำนวนประชากรผู้ประสบภัยพิบัติ แต่ยังต้องพิจารณาความสอดคล้องกับแผนรับมือภัยพิบัติBangkok outperforms the national average on the number of people affected by disasters, but alignment with disaster-response plans still needs review.
ตัวชี้วัดของกรุงเทพฯBangkok’s indicators (1)
| รหัสCode | ตัวชี้วัดIndicator | ค่ากรุงเทพฯBangkok value | ระดับเทียบค่าประเทศLevel vs national |
|---|---|---|---|
| 13.1.1 | จำนวนผู้เสียชีวิต สูญหาย และได้รับผลกระทบโดยตรงจากภัยพิบัติ (คน/แสน)Deaths, missing persons and people directly affected by disasters (per 100,000) | 1.03 | ดีกว่าค่าเฉลี่ยประเทศBetter than the national average |
จุดแข็งStrengths
- กรุงเทพฯ มีแผนรับมือภัยพิบัติสาธารณภัยBangkok has a disaster-response plan
- ผู้ประสบภัยพิบัติต่อแสนคนต่ำกว่าค่าประเทศDisaster-affected people per 100,000 is below the national average
ความท้าทายChallenges
- ยังขาดความชัดเจนในแผนลดการปล่อยก๊าซเรือนกระจกThe plan to cut greenhouse-gas emissions is still unclear
- ต้องรายงานข้อมูลการปล่อยก๊าซอย่างต่อเนื่องEmissions data needs to be reported continuously
อนุรักษ์และใช้ประโยชน์จากมหาสมุทร ทะเล และทรัพยากรทางทะเลอย่างยั่งยืนConserve and sustainably use the oceans, seas and marine resources
ติดตามประเมินไม่ได้Cannot be assessed 0 ตัวชี้วัดที่ติดตามได้trackable indicatorsกรุงเทพฯ ยังไม่สามารถติดตามและประเมินผลตัวชี้วัดในเป้าหมายนี้ได้Bangkok cannot yet track or assess the indicators under this goal.
ตัวชี้วัดของกรุงเทพฯBangkok’s indicators (0)
จุดแข็งStrengths
- กรุงเทพฯ มีการจัดการมลภาวะของน้ำที่เกี่ยวข้องกับพื้นที่ทางทะเลBangkok manages water pollution affecting marine areas
ความท้าทายChallenges
- ต้องประสานงานขอข้อมูลจากกรมทรัพยากรทางทะเลและชายฝั่งData must be requested from the Department of Marine and Coastal Resources
- ประเด็น 14.1.1, 14.3.1, 14.5.1 ยังขาดข้อมูลIssues 14.1.1, 14.3.1 and 14.5.1 lack data
ปกป้อง ฟื้นฟู และสนับสนุนการใช้ระบบนิเวศบนบกอย่างยั่งยืนProtect, restore and promote sustainable use of terrestrial ecosystems
ต่ำกว่าประเทศเกิน 20%More than 20% below national 1 ตัวชี้วัดที่ติดตามได้trackable indicatorsกรุงเทพฯ มีผลดำเนินงานต่ำกว่าค่าประเทศสำหรับสัดส่วนพื้นที่ป่าไม้ เนื่องจากความเป็นเมืองสูงBangkok performs below the national average on forest cover, because it is highly urbanised.
ตัวชี้วัดของกรุงเทพฯBangkok’s indicators (1)
| รหัสCode | ตัวชี้วัดIndicator | ค่ากรุงเทพฯBangkok value | ระดับเทียบค่าประเทศLevel vs national |
|---|---|---|---|
| 15.1.1 | สัดส่วนของพื้นที่ป่าไม้ต่อพื้นที่ดินทั้งหมด (%)Forest area as a proportion of total land area (%) | 0.33 | ต่ำกว่าประเทศเกิน 20%More than 20% below national |
จุดแข็งStrengths
- มีแนวโน้มการเพิ่มพื้นที่ป่าไม้อย่างต่อเนื่องForest area is increasing steadily
- กรุงเทพฯ มีเป้าหมาย Green Bangkok 2030Bangkok has a Green Bangkok 2030 target
ความท้าทายChallenges
- สัดส่วนพื้นที่ป่าไม้เพียง 0.33% ต่ำกว่าค่าประเทศมากกว่า 20%Forest cover of only 0.33%, more than 20% below the national average
- ขาดข้อมูลคุณภาพดินและความหลากหลายทางชีวภาพNo data on soil quality or biodiversity
ส่งเสริมสังคมที่สงบสุขและครอบคลุมเพื่อการพัฒนาที่ยั่งยืนPromote peaceful and inclusive societies for sustainable development
ต่ำกว่าประเทศ 10–20%10–20% below national 6 ตัวชี้วัดที่ติดตามได้trackable indicatorsกรุงเทพฯ มีผลดำเนินงานสูงกว่าค่าประเทศสำหรับประเด็นอาชญากรรม ความรุนแรง และความเป็นธรรมในการพิจารณาคดีBangkok outperforms the national average on crime, violence and fairness in the justice process.
ตัวชี้วัดของกรุงเทพฯBangkok’s indicators (6)
| รหัสCode | ตัวชี้วัดIndicator | ค่ากรุงเทพฯBangkok value | ระดับเทียบค่าประเทศLevel vs national |
|---|---|---|---|
| 16.1.1 | การจับกุมคดีฆ่าผู้อื่นและทำร้ายผู้อื่นจนถึงแก่ความตาย (คดี/แสน)Arrests for homicide and assault resulting in death (cases per 100,000) | 2.02 | ดีกว่าค่าเฉลี่ยประเทศBetter than the national average |
| 16.1.3 | การจับกุมคดีพยายามฆ่า ทำร้ายร่างกาย และข่มขืนกระทำชำเรา (คดี/แสน)Arrests for attempted murder, assault and rape (cases per 100,000) | 30.96 | ต่ำกว่าประเทศเกิน 20%More than 20% below national |
| 16.2.2 | จำนวนผู้เสียหายในคดีค้ามนุษย์ (คน/แสน)Victims of human trafficking (per 100,000) | 1.56 | ต่ำกว่าประเทศเกิน 20%More than 20% below national |
| 16.3.1 | สถิติให้บริการรับแจ้งกรณีความรุนแรง สายด่วน 1300 (คน)Calls to the 1300 violence hotline (people) | 570 | ดีกว่าค่าเฉลี่ยประเทศBetter than the national average |
| 16.5.1 | ผลคะแนน ITA ข้อ E4 การรับสินบนของเจ้าหน้าที่ (คะแนน)ITA score, item E4: bribery of officials (points) | 97.78 | ดีกว่าค่าเฉลี่ยประเทศBetter than the national average |
| 16.6.2 | ITA หมวด 6 คุณภาพการดำเนินงาน (คะแนน)ITA category 6: quality of operations (points) | 83.51 | ต่ำกว่าประเทศไม่เกิน 10%Up to 10% below national |
จุดแข็งStrengths
- ITA คะแนนสูบสินบนสูง (97.78)High ITA anti-bribery score (97.78)
- กระบวนการยุติธรรมดีGood justice process
- สายด่วนรับแจ้งความรุนแรงทำงานThe violence hotline is working
ความท้าทายChallenges
- การจับกุมคดีพยายามฆ่า 30.96 คดี/แสน ต่ำกว่าค่าประเทศ >20%Arrests for attempted murder of 30.96 per 100,000, more than 20% worse than the national average
- คดีค้ามนุษย์ยังสูงกว่าค่าประเทศมากHuman trafficking cases are far above the national average
เสริมความเข้มแข็งให้แก่กลไกการดำเนินงานและฟื้นฟูสภาพหุ้นส่วนความร่วมมือระดับโลกStrengthen the means of implementation and revitalise the global partnership
ดีกว่าค่าเฉลี่ยประเทศBetter than the national average 4 ตัวชี้วัดที่ติดตามได้trackable indicatorsกรุงเทพฯ มีผลดำเนินงานสูงกว่าค่าประเทศสำหรับการจัดเก็บภาษีท้องถิ่นและการเข้าถึงอินเทอร์เน็ตBangkok outperforms the national average on local tax collection and internet access.
ตัวชี้วัดของกรุงเทพฯBangkok’s indicators (4)
| รหัสCode | ตัวชี้วัดIndicator | ค่ากรุงเทพฯBangkok value | ระดับเทียบค่าประเทศLevel vs national |
|---|---|---|---|
| 17.1.1 | สัดส่วนรายได้ภาครัฐต่อ GDP (%)Government revenue as a proportion of GDP (%) | 1.83 | ต่ำกว่าประเทศเกิน 20%More than 20% below national |
| 17.1.2 | สัดส่วนงบประมาณภายในประเทศที่จัดสรรจากภาษี (%)Proportion of the domestic budget funded by taxes (%) | 16.29 | ดีกว่าค่าเฉลี่ยประเทศBetter than the national average |
| 17.8.1 | สัดส่วนประชากรที่ใช้อินเทอร์เน็ต (%)Proportion of the population using the internet (%) | 75.20 | ดีกว่าค่าเฉลี่ยประเทศBetter than the national average |
| 17.17.1 | จำนวนเงินที่เห็นชอบให้ใช้ในโครงการ PPP (ล้านบาท)Amount committed to public–private partnership (PPP) projects (THB million) | 419,805 | เทียบไม่ได้Not comparable |
จุดแข็งStrengths
- สัดส่วนงบประมาณจากภาษีสูง (16.29%)High share of the budget from taxes (16.29%)
- การเข้าถึงอินเทอร์เน็ต 75.20%Internet access of 75.20%
- มูลค่า PPP สูงมากVery high PPP value
ความท้าทายChallenges
- สัดส่วนรายได้ภาครัฐต่อ GDP เพียง 1.83% ต่ำกว่าค่าประเทศ >20%Government revenue of only 1.83% of GDP, more than 20% below the national average
- ต้องพัฒนาฐานรายได้ของกรุงเทพฯBangkok's revenue base needs to be developed
ประเด็นที่ประชาชนกรุงเทพฯ เห็นว่าเร่งด่วนIssues Bangkok residents see as most urgent
คะแนนความเร่งด่วน 0–10 จากการสำรวจความเห็นประชาชนUrgency score from 0 to 10, from a public opinion survey
1 1 ยุติความยากจนNo poverty9.30 2 3 สุขภาพและสวัสดิภาพHealth and well-being8.70 3 4 การศึกษาEducation8.53 4 13 รับมือภูมิอากาศClimate action8.42 5 8 งานที่ดีและเศรษฐกิจDecent work and economy8.29ความคาดหวังของประชาชน เทียบการดำเนินงานของภาครัฐCitizens’ expectations compared with government performance
ช่องว่างยิ่งมาก ประชาชนยิ่งคาดหวังเกินกว่าที่ภาครัฐทำได้The bigger the gap, the more people expect than the government delivers
1 ยุติความยากจนNo povertyช่องว่างGap −5.73 ความคาดหวังExpectation9.30 ภาครัฐGovernment3.57 13 รับมือภูมิอากาศClimate actionช่องว่างGap −5.95 ความคาดหวังExpectation8.82 ภาครัฐGovernment2.87 3 สุขภาพHealthช่องว่างGap −5.88 ความคาดหวังExpectation8.70 ภาครัฐGovernment2.82 8 งานที่ดีฯDecent workช่องว่างGap −5.60 ความคาดหวังExpectation8.29 ภาครัฐGovernment2.69 4 การศึกษาEducationช่องว่างGap −5.89 ความคาดหวังExpectation8.53 ภาครัฐGovernment2.64